Door nieuwe studies is de droogte (en hoeveelheid) van een la Nina beter te voorspellen
Algemeen weernieuws
Improved ability to predict strength and duration of droughts caused by La Niña

Two new studies from The University of Texas at Austin have significantly improved scientists' ability to predict the strength and duration of droughts caused by La Niña - a recurrent cooling pattern in the tropical Pacific Ocean. Their findings, which predict that the current La Niña is likely to stretch into the second year, could help scientists know years in advance how a particular La Niña event is expected to evolve.
"Some La Niña events last two years, and predicting them is extremely challenging," said Pedro DiNezio, a research associate at the University of Texas Institute for Geophysics (UTIG).
The studies were published in November in the journal Geophysical Research Letters. DiNezio and UTIG Research Associate Yuko Okumura were authors on both studies and collaborated with scientists from the National Center for Atmospheric Research (NCAR). UTIG is a research unit of the UT Jackson School of Geosciences.
The southern United States, including parts of eastern Texas, regularly experiences warm and dry winters caused by La Niña. Therefore, predicting La Niña's evolution, particularly its duration, is key.
The first study, led by Okumura, showed that La Niña's impact on atmospheric circulation and southern U.S. drought becomes stronger in the second year. This is despite a weakening of La Niña's cooling over the tropical Pacific relative to the first year.
"We expected a weaker impact in the second year, but it turned out to be the opposite," said Okumura. "Despite being weaker in the second year, La Niña appears to have a greater impact."
Okumura found that this paradox is caused by subtle changes in the pattern of tropical Pacific cooling. During the second year, the cooling weakens in a narrow band along the equator but becomes broader. The broader cooling appears more effective at influencing the atmosphere far away from the tropical Pacific, according to the analysis of historical observations.
"Predicting if La Niña will last multiple years is therefore essential to knowing how long the drought will last," Okumura said.
The second study, led by DiNezio, used a climate model developed at NCAR to predict that an ongoing La Niña that started in 2016 will stretch into its second year this upcoming winter. The model puts the probability of such an event occurring at 60 to 80%.
DiNezio and Okumura had previously found that a La Niña is more likely to last two years when it is preceded by a strong El Niño - its warm counterpart. Therefore, when a record-breaking El Niño event occurred just two years ago, they anticipated that it could lead to a two-year La Niña. DiNezio used the model developed at NCAR to test this idea.
To back their predictions, they tested whether the model could have predicted previous two-year La Niña events that occurred after strong El Niños. They were particularly confident in the model when they saw that it predicted the three-year La Niña following the 1997 El Niño, a record-breaking event at the time.

Computer models show predicted and observed rainfall anomalies around the globe during the second year of La Niña events, including a future prediction for 2018. Predicted values are on the left and observed on the right. The rainfall anomaly refers to the deviation in rainfall during a particular year compared to the expected rainfall for the region. Pedro DiNezio/University of Texas Institute for Geophysics/ Jackson School of Geosciences.
So far, it looks like the NCAR model's prediction is on the money. The National Oceanic and Atmospheric Administration (NOAA) announced last week that ocean conditions in the tropical Pacific are starting to show signs that La Niña is on its way for a second year.
DiNezio and Okumura will be keeping a close eye on this year's La Niña as they seek to better predict its impacts throughout the world.
Provided by University of Texas
Featured image: The La Niña weather pattern may cause droughts in the southern United States, including parts of eastern Texas. Credit: The National Oceanic and Atmospheric Administration.
Bron: https://watchers.news/2017/11/17/improved-ability-to-predict-strength-and-duration-of-droughts-caused-by-la-nina/
La Niña
Vaak horen we berichten over El Niño. La Niña is haar tegenhanger met relatief koud water.Bij een La Niña zijn de zeewatertemperaturen in een deel van de Stille Oceaan nabij de evenaar lager dan gemiddeld. Door een sterkere passaatwind komt meer koud water uit de diepe oceaan aan de oppervlakte. La Niña is de tegenhanger van El Niño. Bij een El Niño warmt de temperatuur van zeewater in de Stille Oceaan juist op.
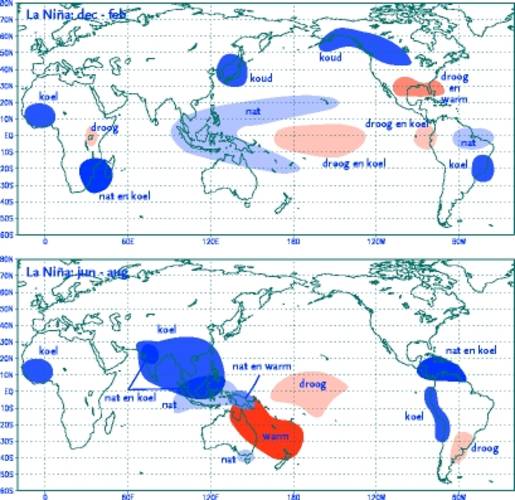
In het najaar van 2010 ontwikkelde zich een ongekend sterke La Niña. De ernstige overstromingen in Australië en de Filippijnen begin 2011 hingen samen met dit weerfenomeen. Australië kreeg door de sterke La Niña ook te maken met een verhoogde activiteit van tropische cyclonen.
Lange La Niña
La Niña duurde deze keer langer dan anders. Meestal wordt het dieptepunt rond Kerstmis bereikt. La Niña was in januari 2011 ongeveer net zo sterk als in september en oktober 2010. In februari was La Niña al een stuk zwakker dan de maand ervoor en sindsdien is het fenomeen verder in sterkte afgenomen.
Gevolgen La Niña
La Niña leidt in het voorjaar vaak tot kouder weer in het noorden van Zuid-Amerika terwijl Mexico een warmere lente mag verwachten. In de tropische en noordelijke Atlantische Oceaan, met uitzondering van de grote Antillen, wordt het voorjaar warmer dan normaal. Op de Filippijnen veroorzaakt La Niña vrijwel altijd meer regen dan normaal in de droge tijd die daar inmiddels is begonnen. Het noordoosten van Brazilië heeft meer kans op natter weer dan normaal.
Gevolgen voor Nederland
In Nederland is het na een La Niña gemiddeld over 150 jaar een fractie droger in het voorjaar. Dit effect is echter heel gering. Zeker in verhouding tot de veel grotere natuurlijke grilligheid van het weer. De kans op een nat voorjaar is ongeveer 20 procent in plaats van 33 procent.
Variatie in sterkte
El Niño’s en La Niña’s variëren in sterkte. Zo was er in 1997/1998 een ongewoon sterke El Niño, met temperatuurafwijkingen tot 6 graden boven normaal. Deze werd zoals gewoonlijk gevolgd door een afkoeling in 1998-2000. In 2003 en 2007 waren er veel zwakkere El Niño's. Nu is de schommeling weer doorgeslagen naar een koudere La Niña.
Bron: https://www.knmi.nl/kennis-en-datacentrum/uitleg/la-nina
EL NIÑO/SOUTHERN OSCILLATION (ENSO)
DIAGNOSTIC DISCUSSION
issued byCLIMATE PREDICTION CENTER/NCEP/NWS
and the International Research Institute for Climate and Society
09 November 2017
ENSO Alert System Status: La Niña Advisory
Synopsis: La Niña conditions are predicted to continue (~65-75% chance) at least through the Northern Hemisphere winter 2017-18.
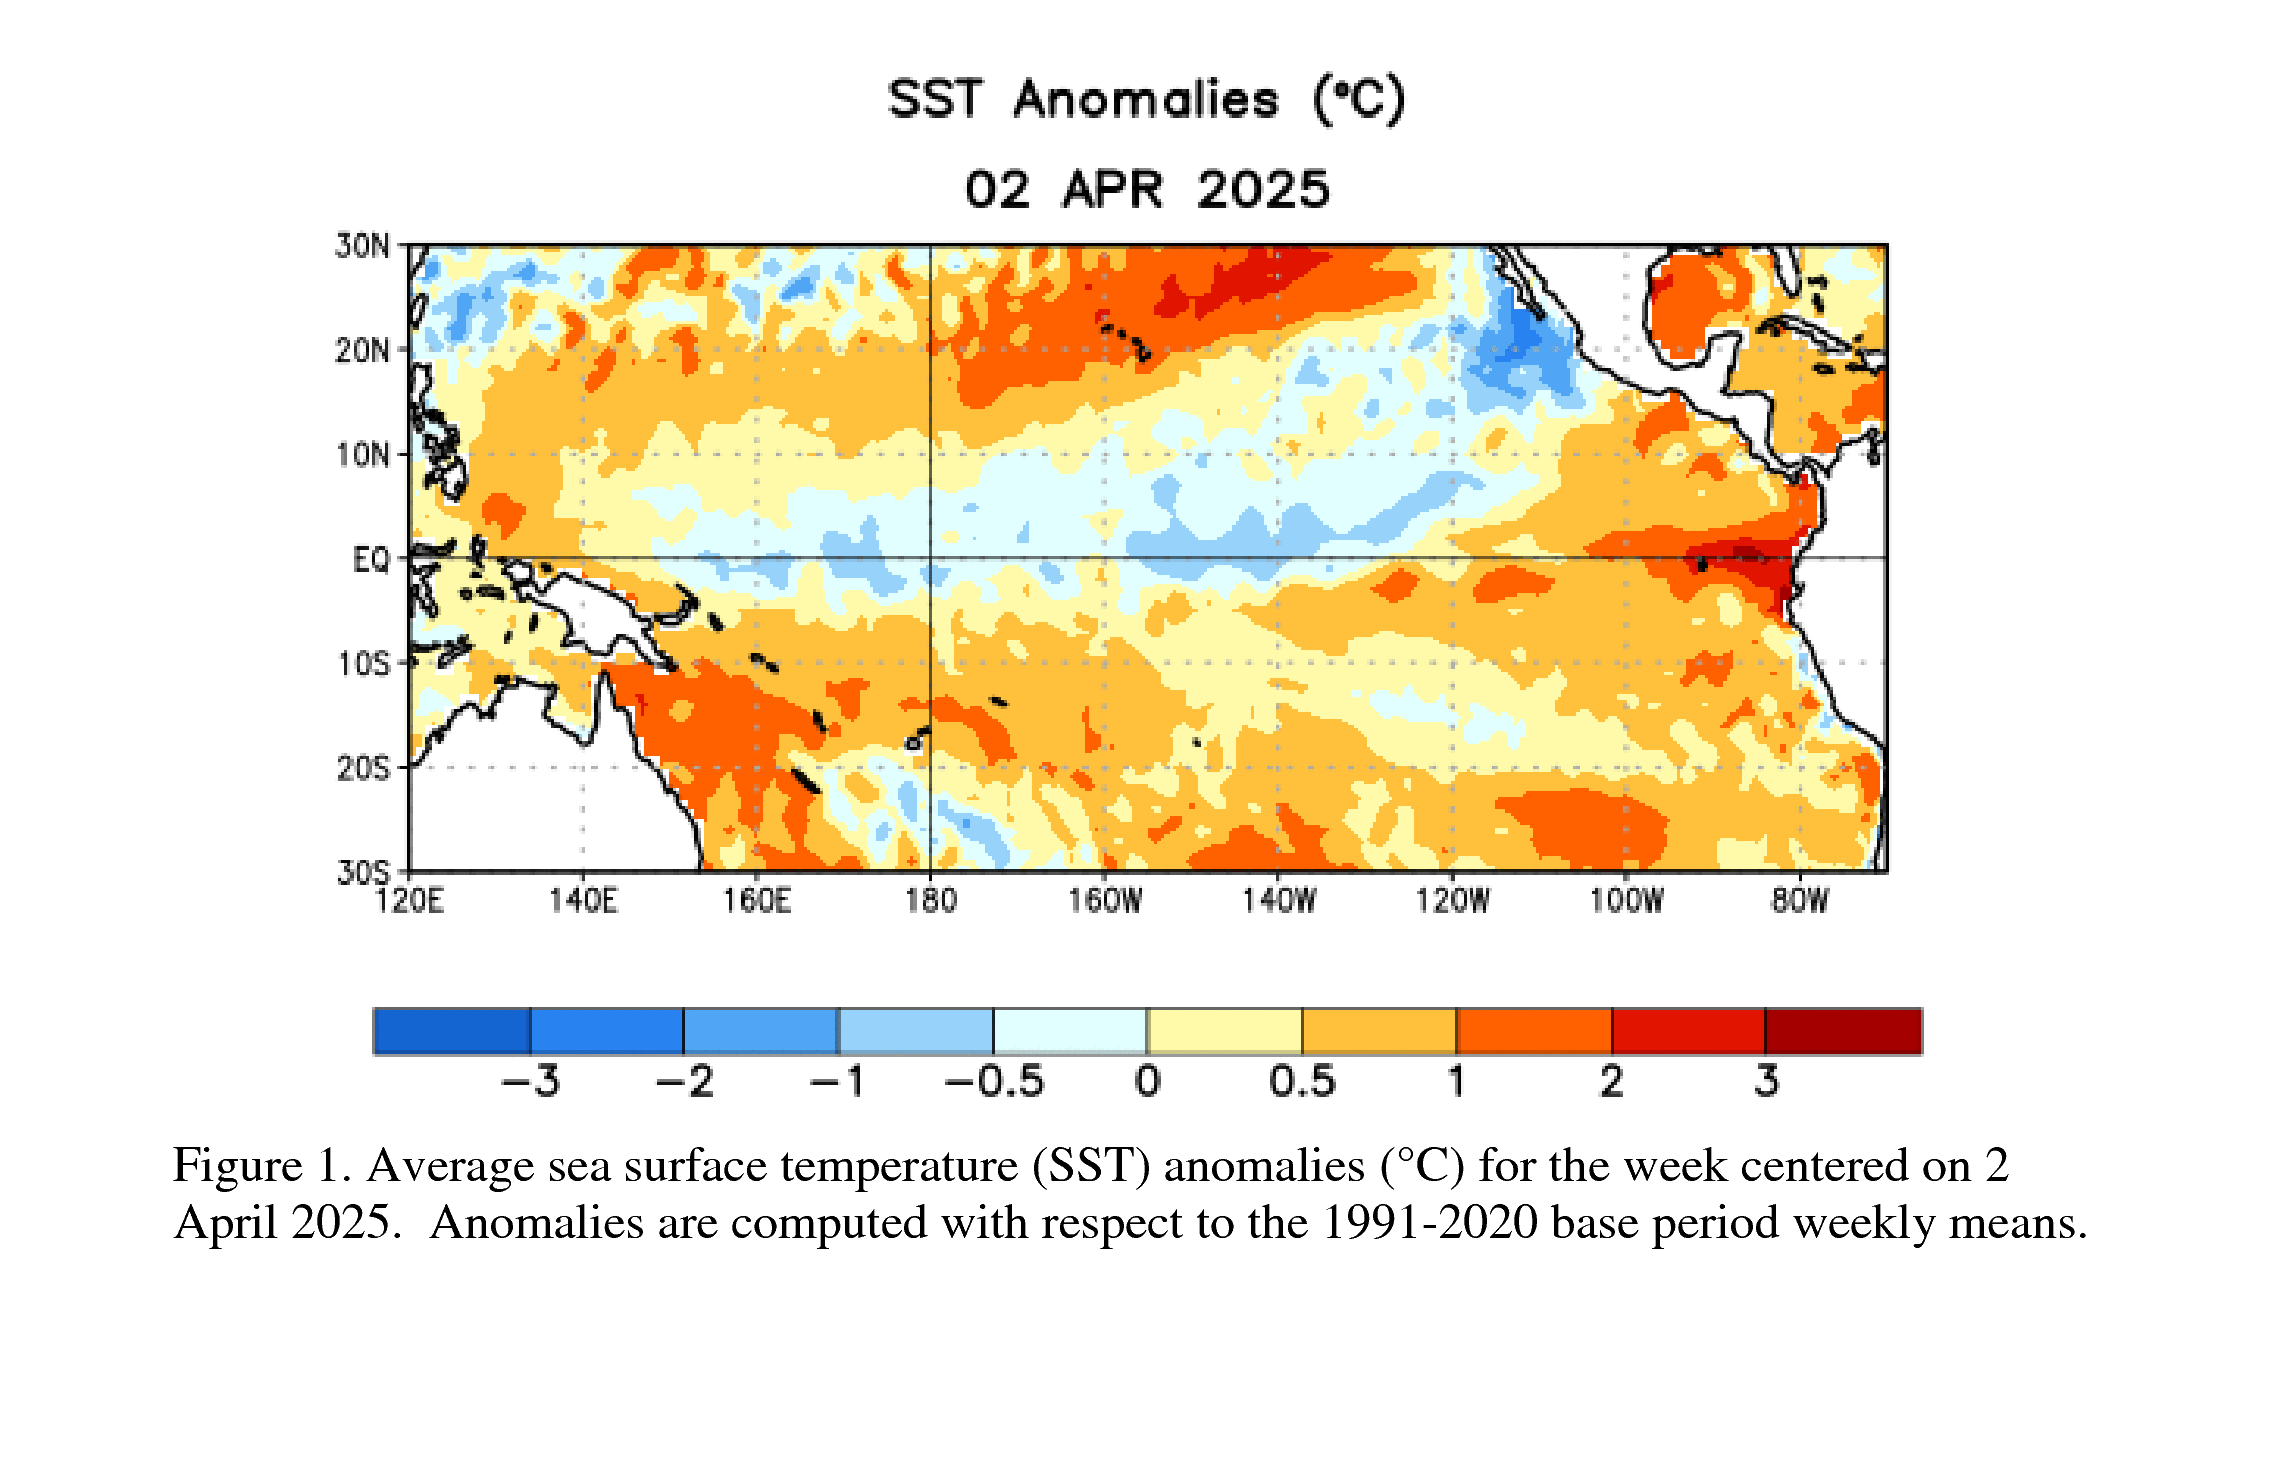
During October, weak La Niña conditions emerged as reflected by below-average sea surface temperatures (SSTs) across most of the central and eastern equatorial Pacific Ocean [Fig. 1].
The weekly Niño indices were variable during the month, with values near -0.5° C during the past week in the Niño-3.4 and Niño-3 regions [Fig. 2].

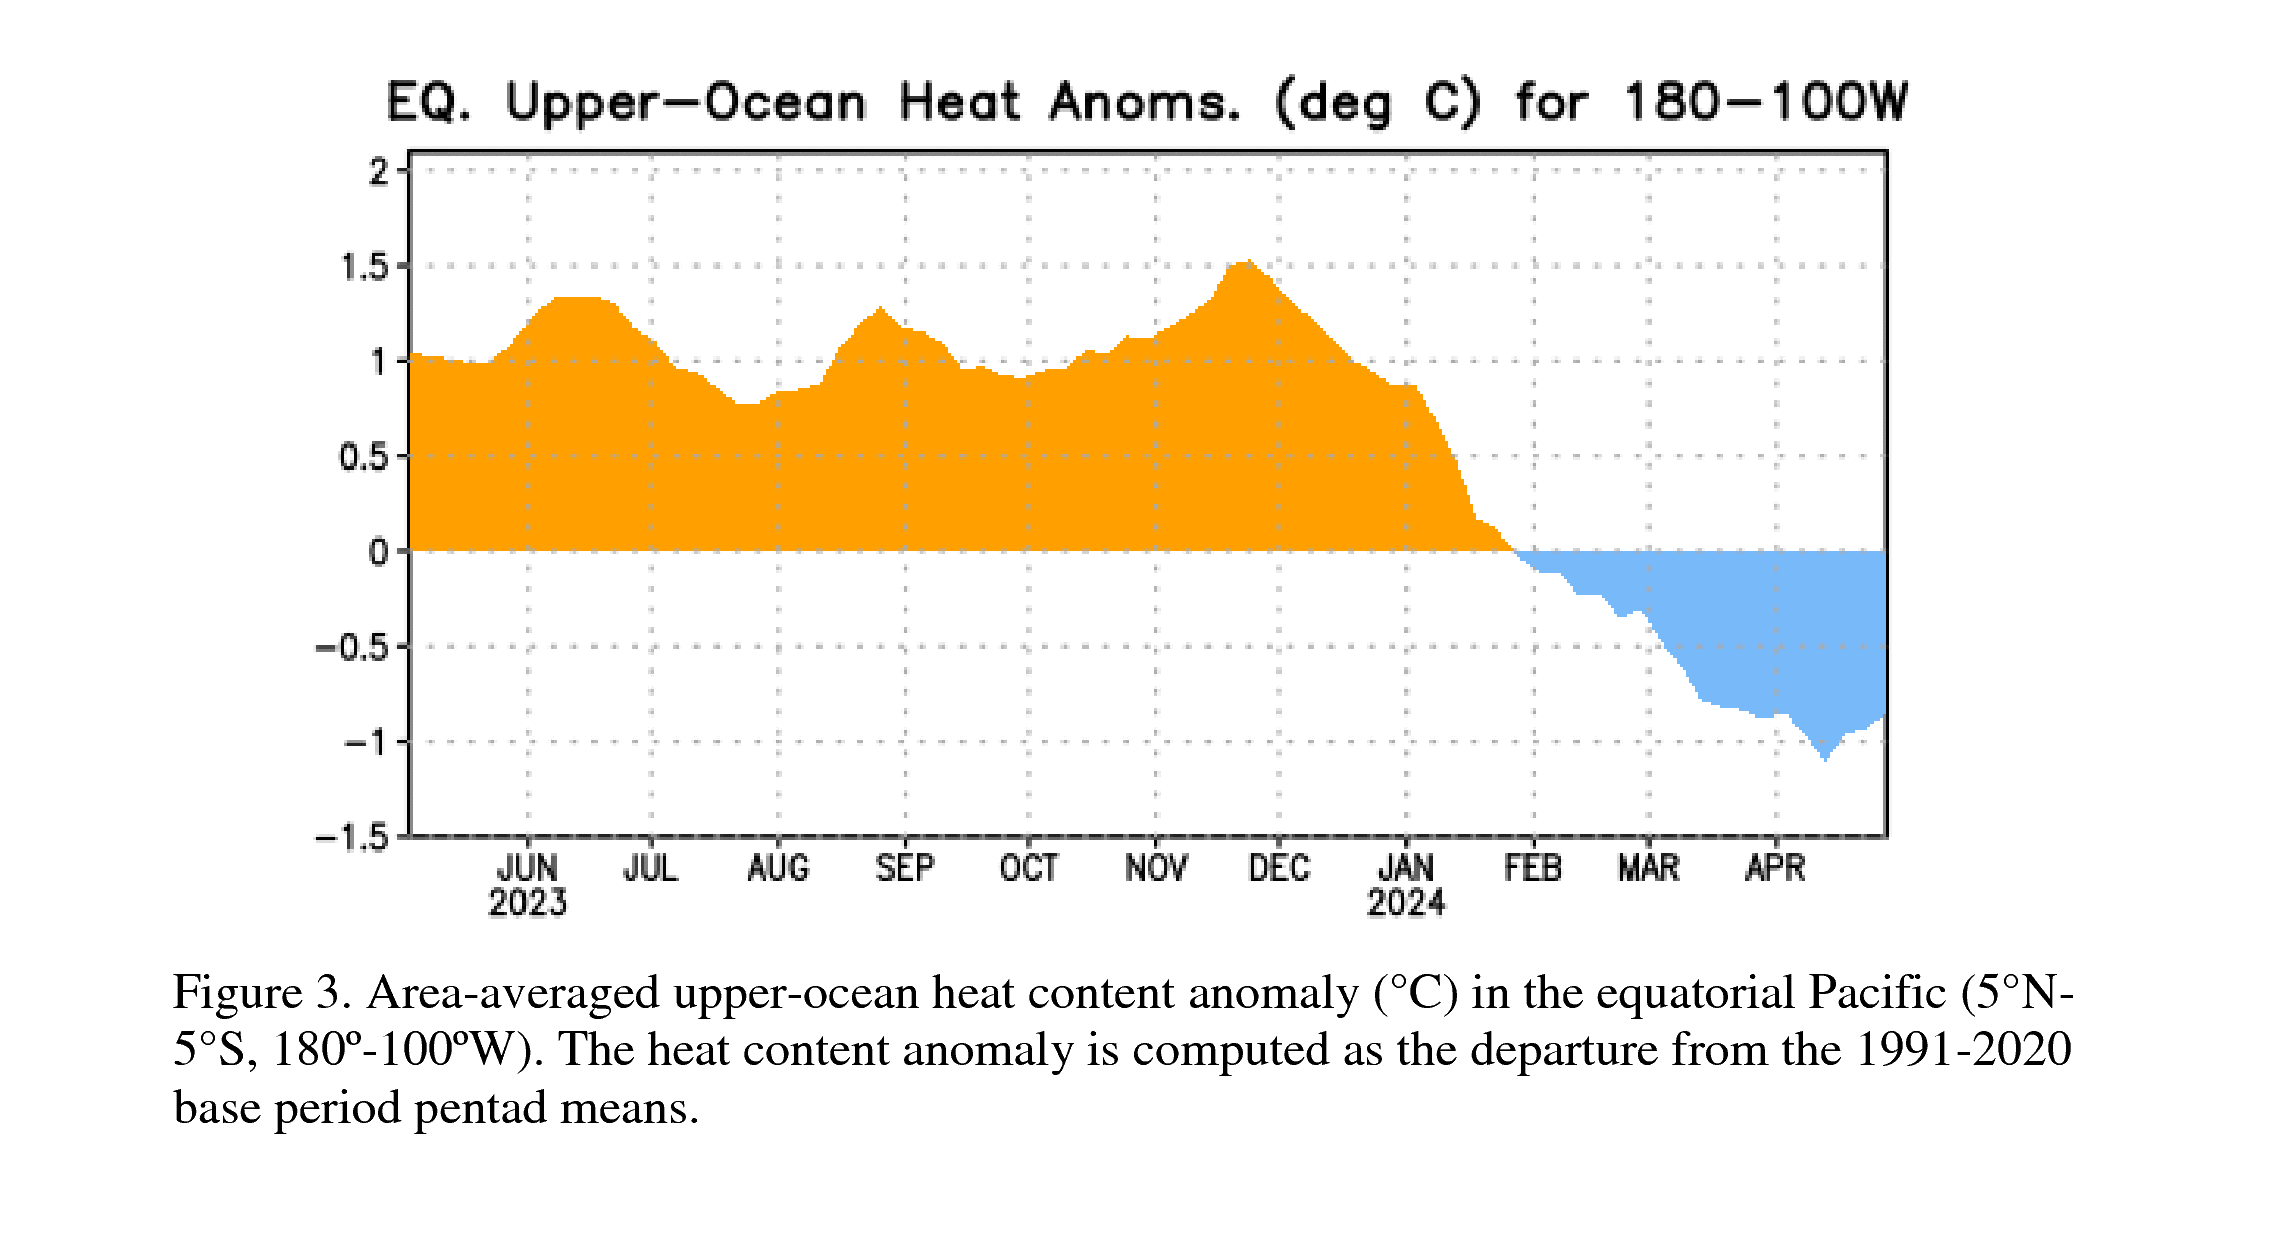
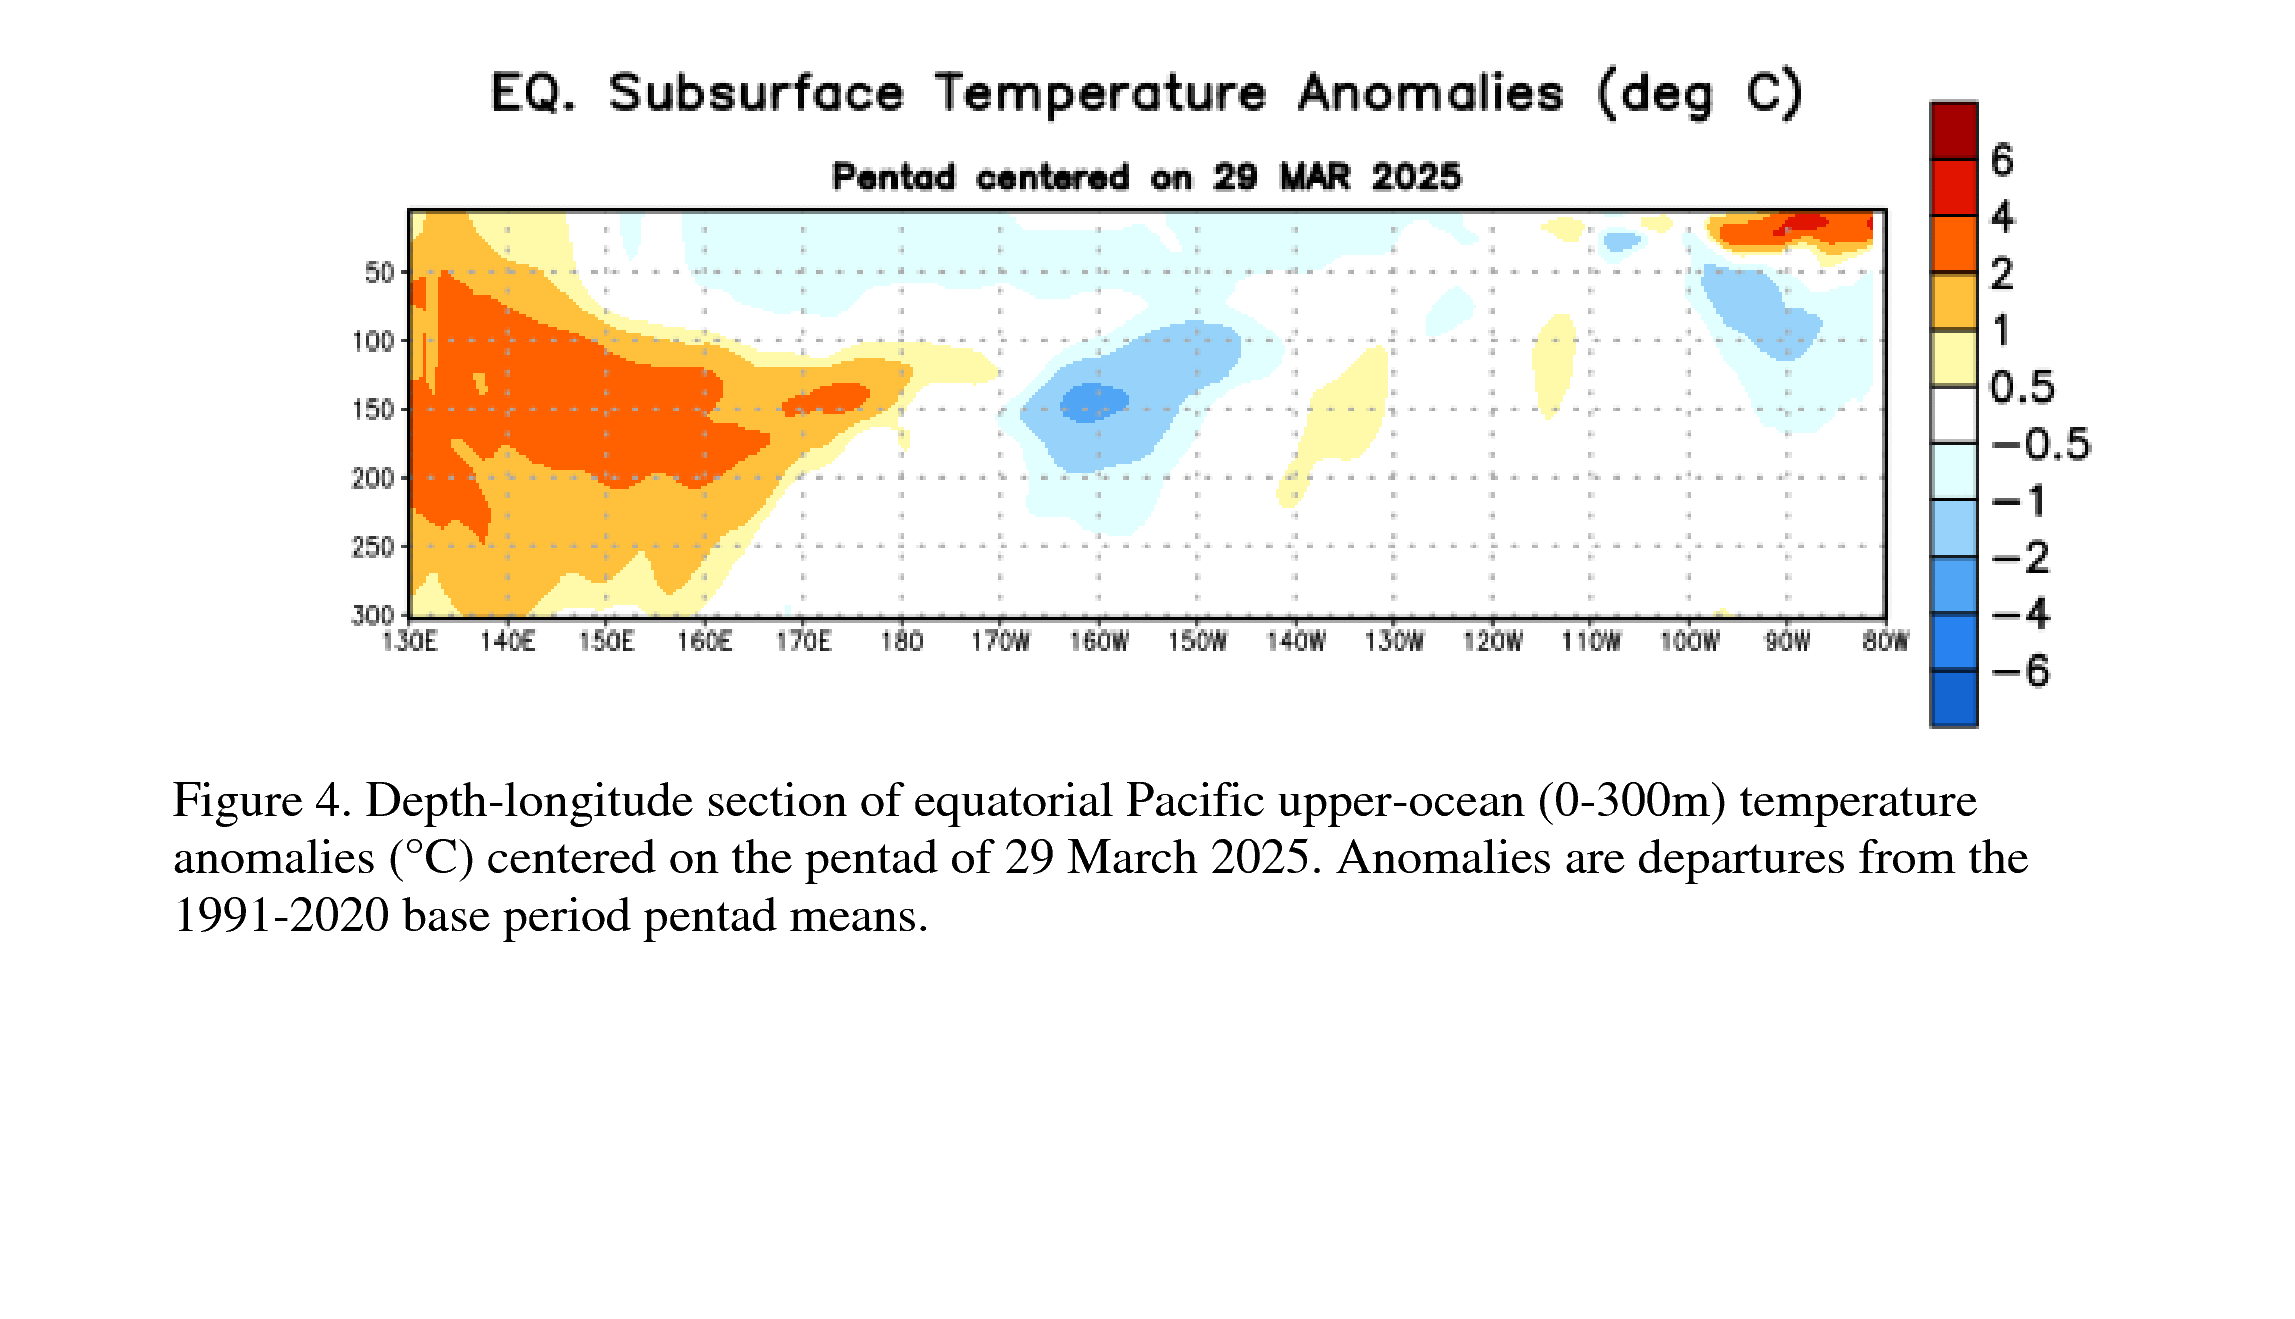
Sub-surface temperatures remained below average during October [Fig. 3], reflecting the anomalously shallow depth of the thermocline across the central and eastern Pacific [Fig. 4].
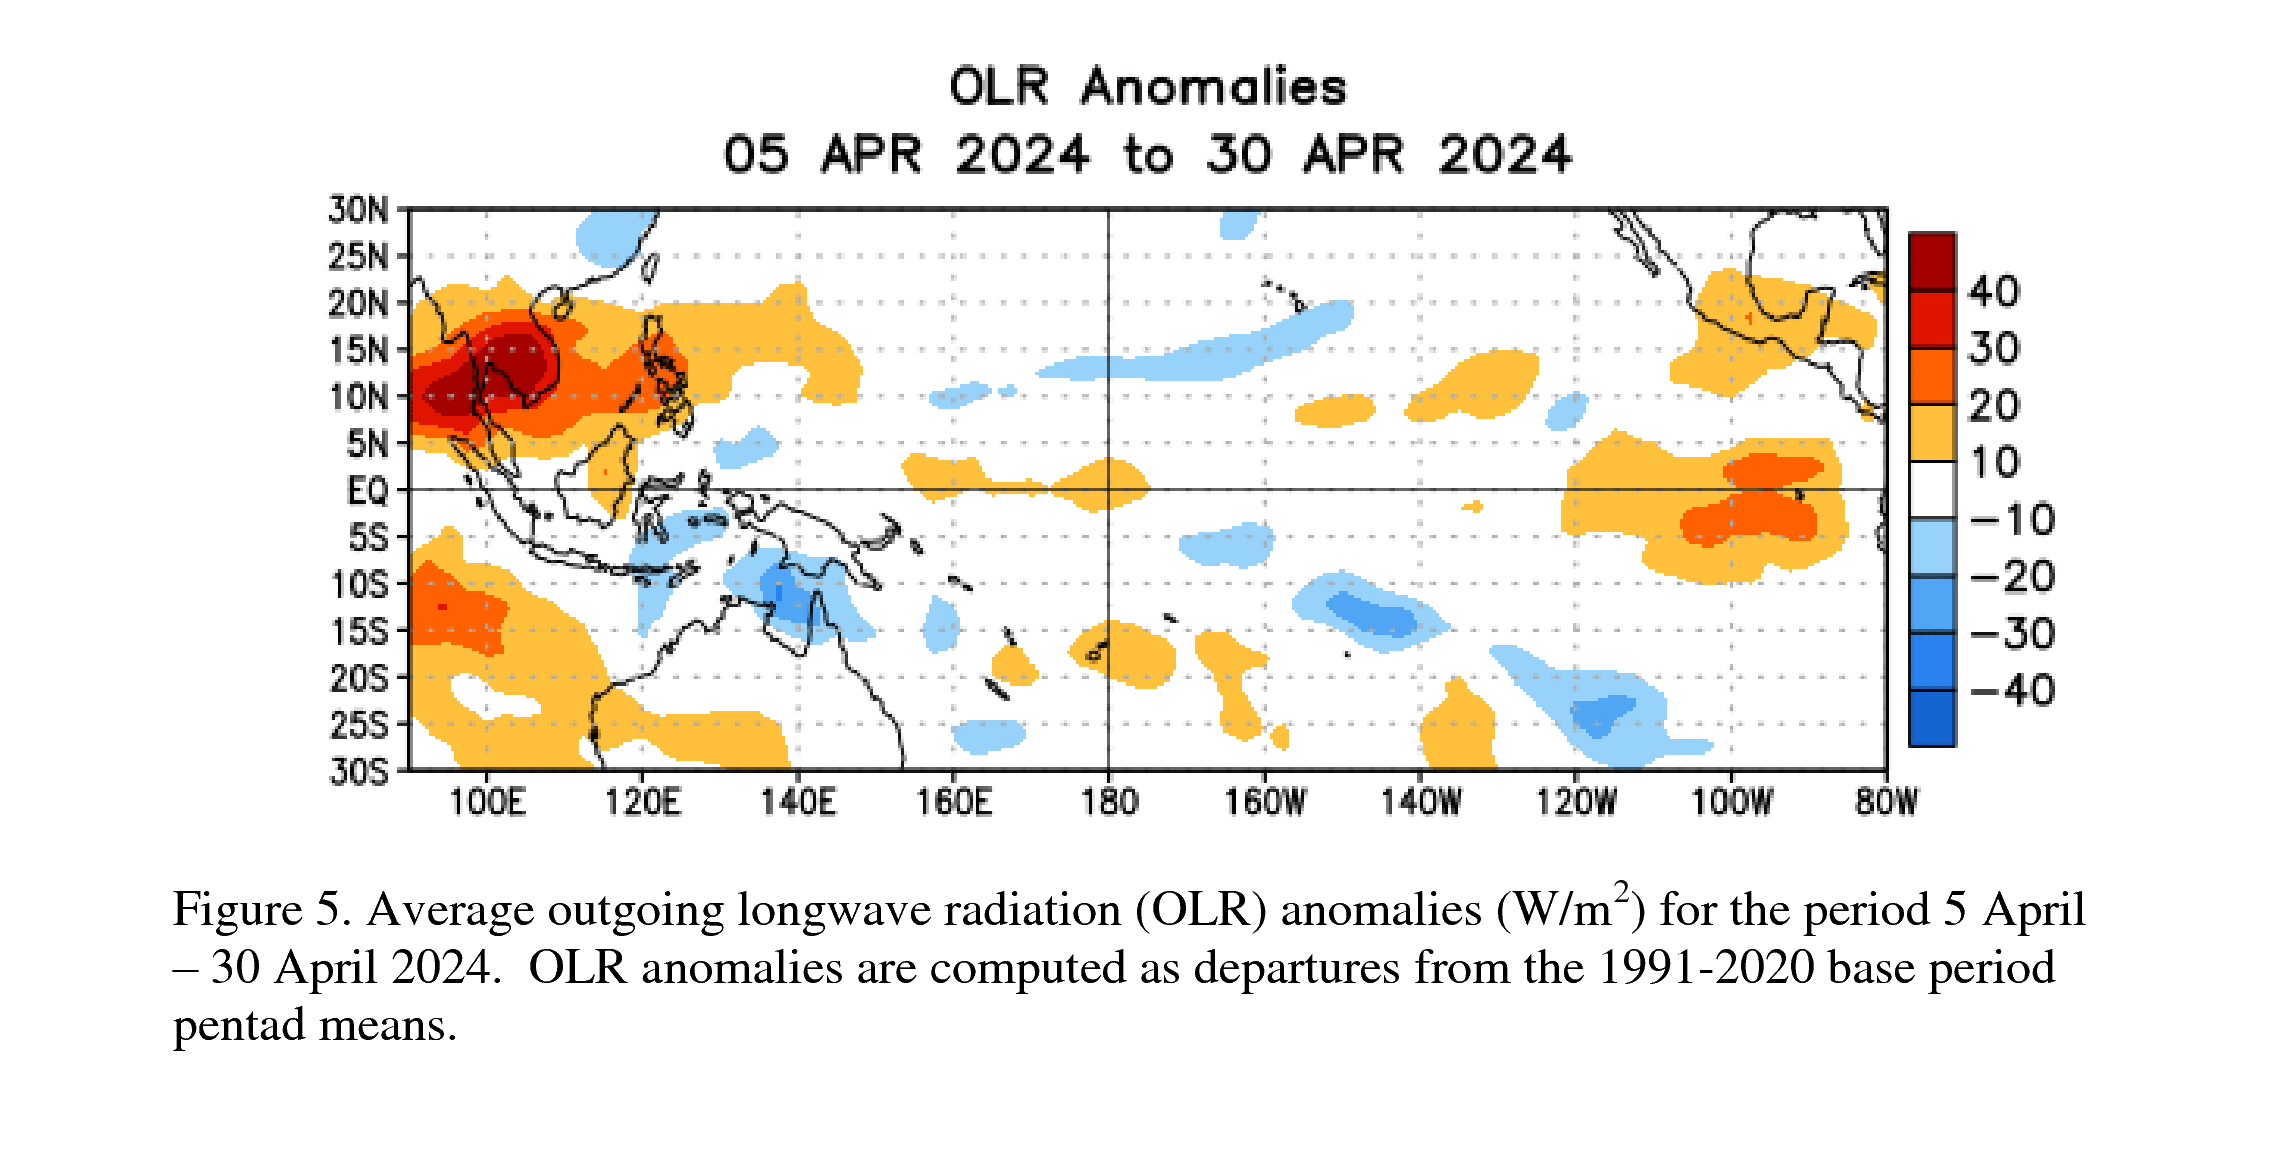
Also, convection was suppressed near the International Date Line and slightly enhanced over parts of the Maritime Continent and the Philippines [Fig. 5].
Over the equatorial Pacific Ocean, low-level trade winds were mainly near average, but the upper-level winds were strongly anomalously westerly and the Southern Oscillation Index was positive. Overall, the ocean and atmosphere system reflects the onset of La Niña conditions.
For the remainder of the Northern Hemisphere fall and winter 2017-18, a weak La Niña is favored in the model averages of the IRI/CPC plume [Fig. 6]
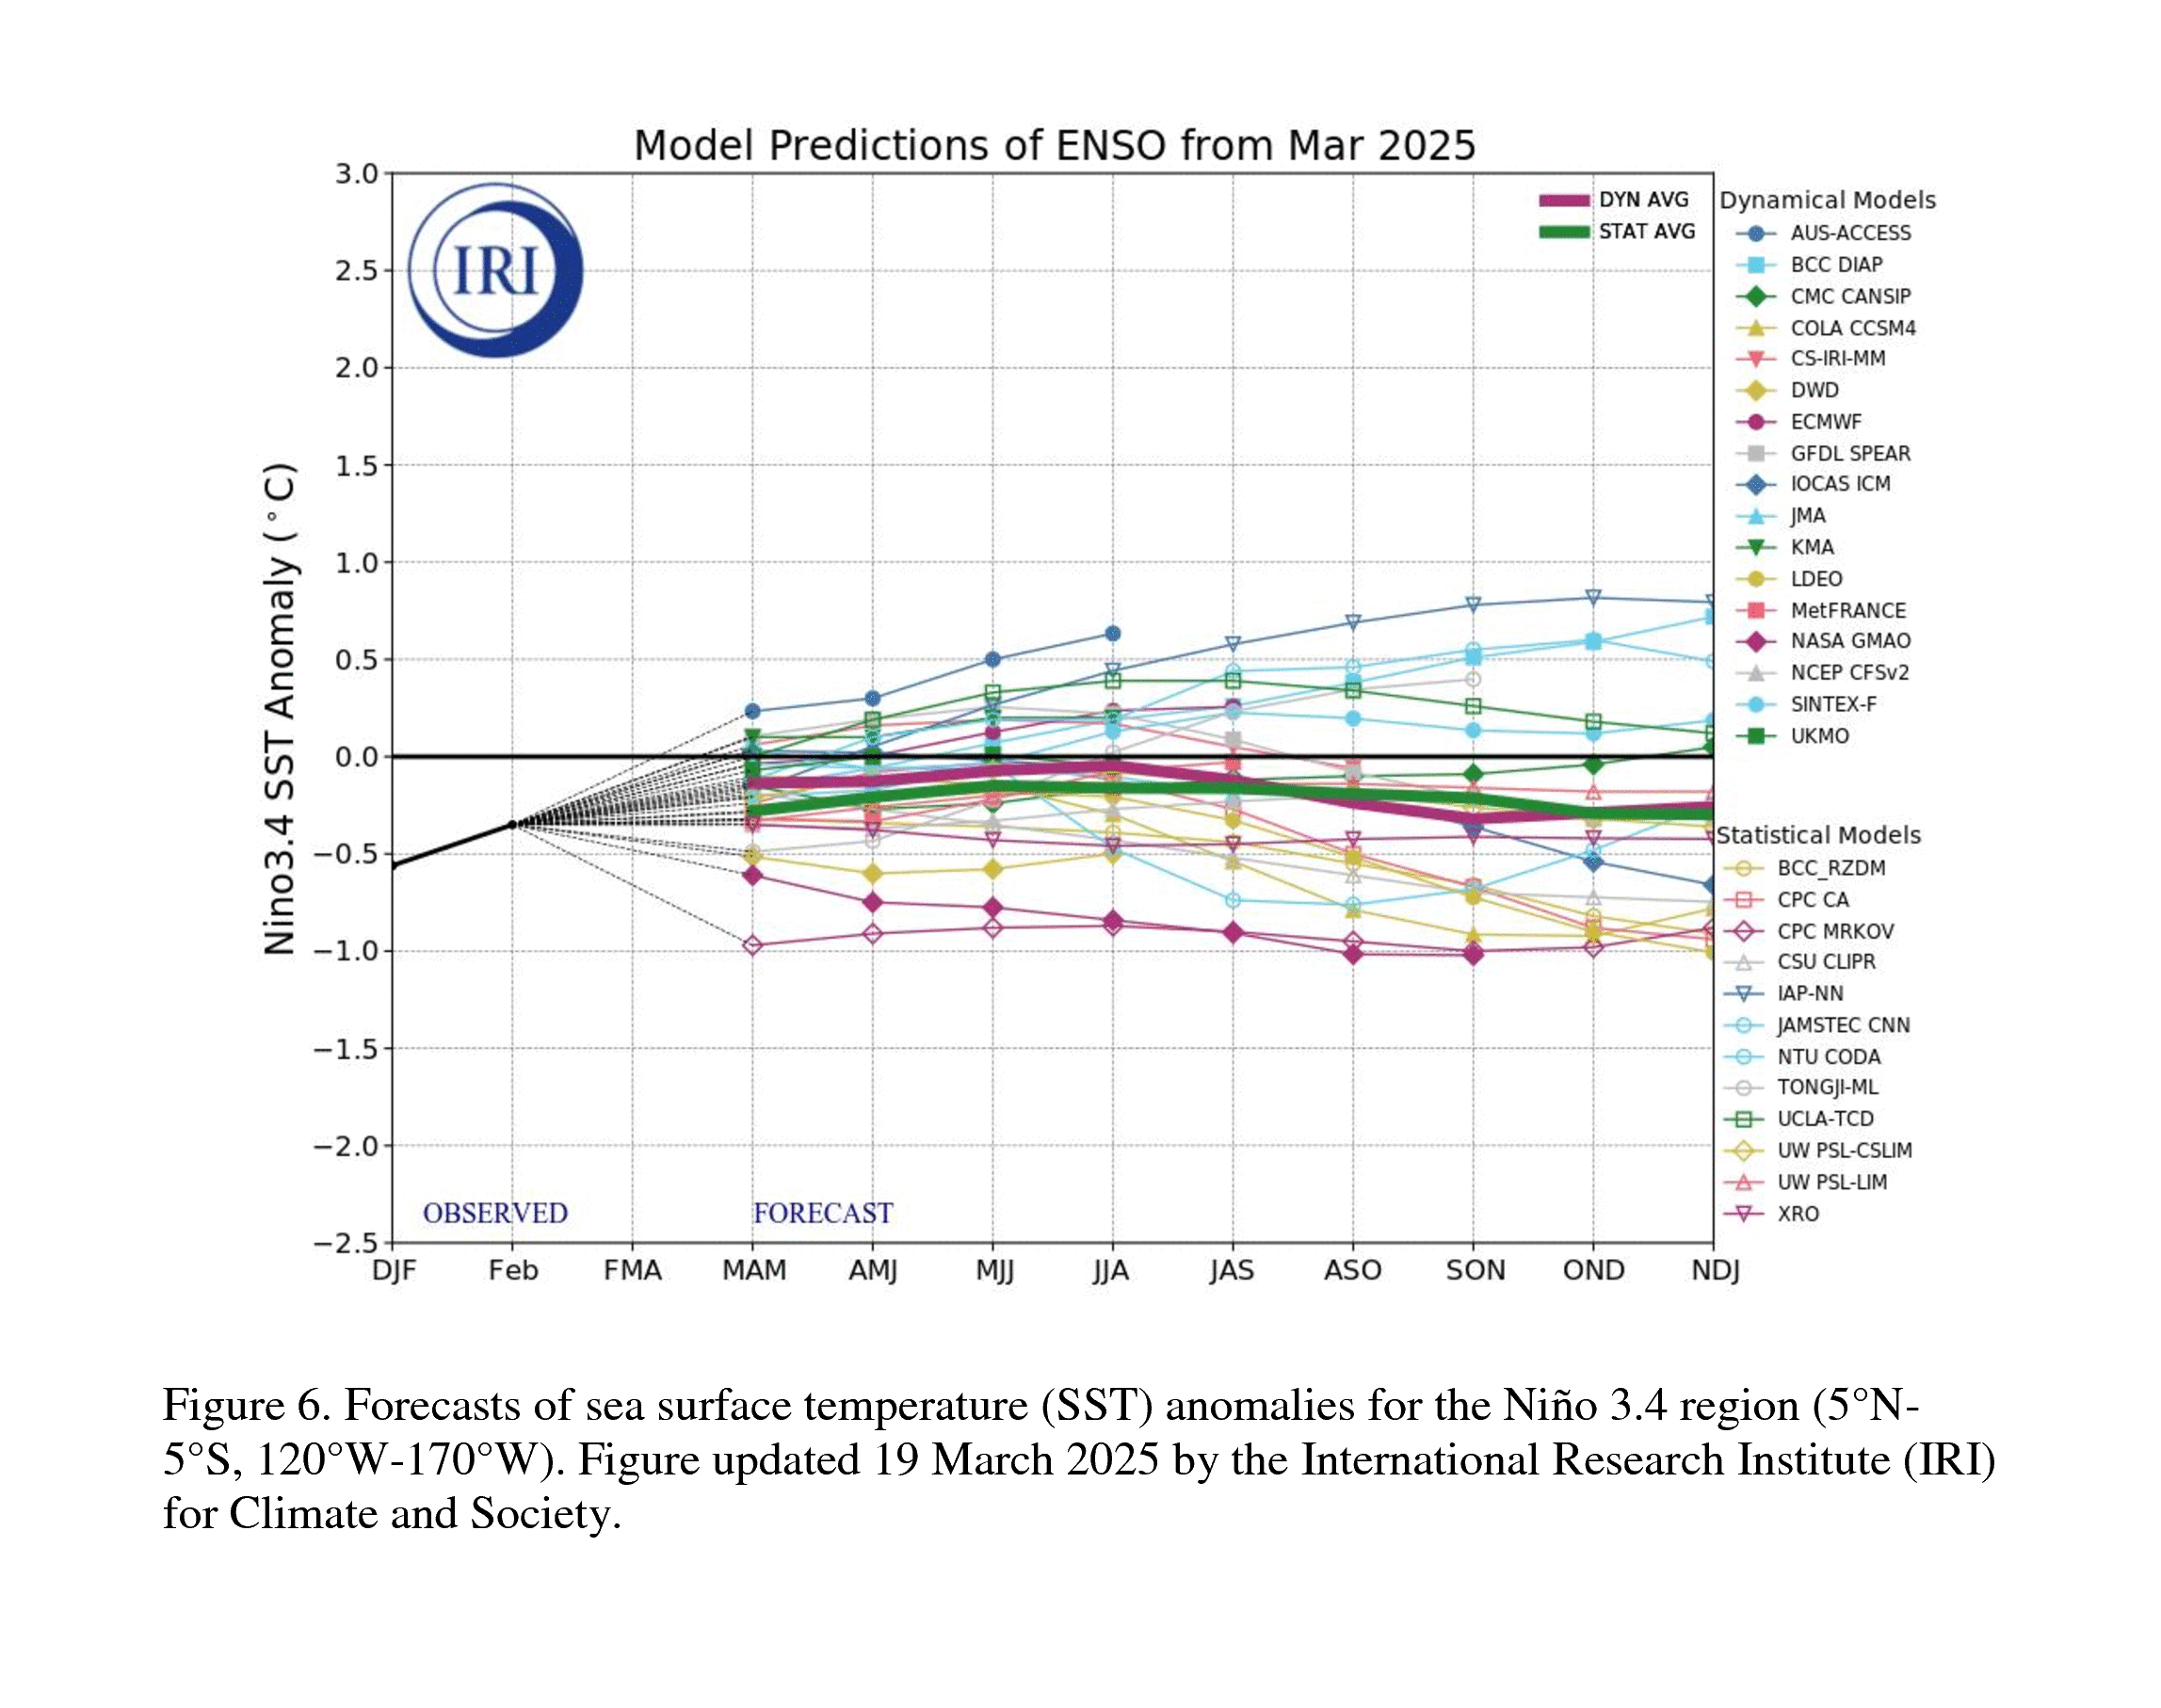
and also in the North American Multi-Model Ensemble (NMME) [Fig. 7].

The consensus of forecasters is for the event to continue through approximately February-April 2018. In summary, La Niña conditions are predicted to continue (~65-75% chance) at least through the Northern Hemisphere winter (click CPC/IRI consensus forecast for the chance of each outcome for each 3-month period).

La Niña is likely to affect temperature and precipitation across the United States during the upcoming months (the 3-month seasonal temperature and precipitation outlooks will be updated on Thursday November 16th).
http://www.cpc.ncep.noaa.gov/products/predictions/90day/
The outlooks generally favor above-average temperatures and below-median precipitation across the southern tier of the United States, and below-average temperatures and above-median precipitation across the northern tier of the United States.
This discussion is a consolidated effort of the National Oceanic and Atmospheric Administration (NOAA), NOAA's National Weather Service, and their funded institutions. Oceanic and atmospheric conditions are updated weekly on the Climate Prediction Center web site (El Niño/La Niña Current Conditions and Expert Discussions).

Forecasts are also updated monthly in the Forecast Forum of CPC's Climate Diagnostics Bulletin. Additional perspectives and analysis are also available in an ENSO blog.
https://www.climate.gov/news-features/department/enso-blog
The next ENSO Diagnostics Discussion is scheduled for 14 December 2017 . To receive an e-mail notification when the monthly ENSO Diagnostic Discussions are released, please send an e-mail message to: ncep.list.enso-update@noaa.gov.
Bron: http://www.cpc.ncep.noaa.gov/products/analysis_monitoring/enso_advisory/ensodisc.shtml
November 2017 La Niña update: She’s back!
Well, it’s November, and the CPC/IRI ENSO forecast is declaring the presence of La Niña conditions! I could just link to my November 2016 post and head home for the day… but that would be no fun! There’s about a 65-75% chance that La Niña conditions will continue at least through the winter. As we head into our fifth “double dip” La Niña (an unofficial term for when neutral conditions briefly prevail in between La Niña winters) in the historical record, let’s dig into what we talk about when we talk about La Niña.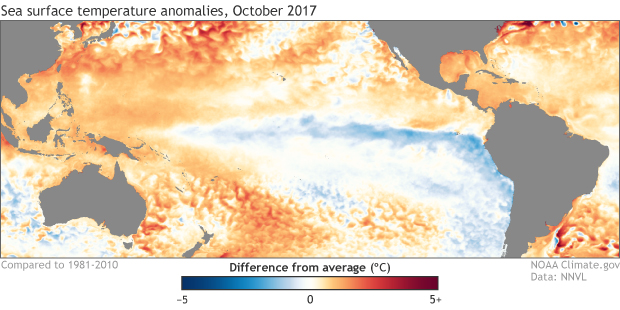
October 2017 sea surface temperature departure from the 1981-2010 average. Graphic by climate.gov; data from NOAA’s Environmental Visualization Lab.
A quick flashback
If you recall, last month there were several signs of the presence of La Niña conditions. East-central tropical Pacific sea surface temperatures were cooler than the long-term average, accompanied by signs of a La Niña-like atmospheric response (more clouds and rain over Indonesia, less over the central Pacific).
Sea surface temperatures in the Niño3.4 region during September came in at about 0.5°C cooler than the long-term average, the first step in our La Niña conditions decision tree. However, the sea surface temperature was showing some volatility, and we just weren’t confident enough in the second step of the flowchart—that the cooler sea surface would persist for several seasons—to be sure that La Niña’s seasonal pattern had locked in.
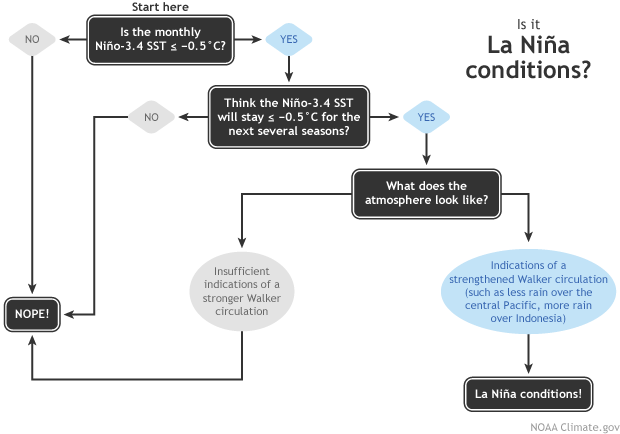
Flowchart showing decision process for determining La Niña conditions. Figure by Fiona Martin, adapted by Climate.gov.
What’s different this month?
In October, despite an active Madden-Julian Oscillation moving through the western Pacific (more on that in a minute), La Niña conditions dominated. Stepping through our flowchart, the sea surface temperature in the Niño3.4 region again averaged about 0.5°C cooler than average (check). Most of the computer models forecast that it will remain in weak La Niña territory(between 0.5°C and 1.0°C below average) through the spring (check).
Another factor bolstering forecasters’ confidence that La Niña will remain in place through the fall and winter 2017/18 is the substantial quantity of cooler-than-average waters below the tropical ocean surface. This will provide a source of cooler waters to the surface over the next few months.
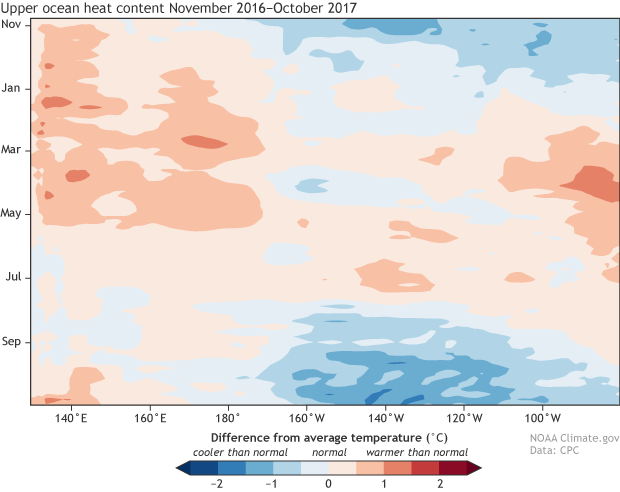
Heat content in the upper few hundred meters of the tropical Pacific near the equator (5°N-5°S) from November 2016 (top of image) through October 2017 (bottom of image) compared to the 1981-2010 average. The western Pacific is on the left; the eastern Pacific is on the right. Each row of the image shows a 5-day average. Scan the image from top to bottom, and you can see the weakening and rebuilding of the La Niña cold pool in the central-eastern Pacific. (Still not quite sure what you're looking at? Read more about Hovmoller diagrams.) NOAA Climate.gov image, based on data provided by the Climate Prediction Center.
Finally, the signs of an atmospheric response I described above continued to be present during October (check). In addition to the clouds and rain pattern, the upper-level winds were stronger than average, another sign of a strengthened Walker Circulation. Also, the Southern Oscillation Index was positive, also indicating a stronger-than-average Walker Circulation. Add it all together, and you get… La Niña!
You promised me an MJO!
Indeed I did. The Madden-Julian Oscillation operates on subseasonal timescales, meaning on the order of weeks or months. The MJO is essentially an area of enhanced convection, storms and clouds that moves eastward along the equator, and can circle the globe in around 4-8 weeks. ENSO (the whole El Niño/La Niña system), on the other hand, is a seasonal, stationary pattern, lasting for at least several months in a row.
The MJO can move through the tropical Pacific and temporarily change conditions, including the winds near the surface.
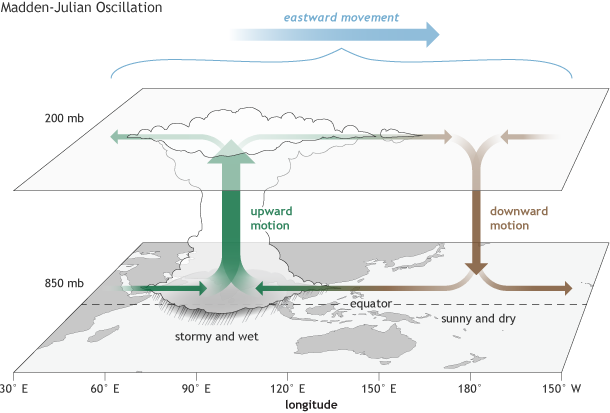
The surface and upper-atmosphere structure of the MJO for a period when the enhanced convective phase (thunderstorm cloud) is centered across the Indian Ocean and the suppressed convective phase is centered over the west-central Pacific Ocean. Horizontal arrows pointing left represent wind departures from average that are easterly, and arrows pointing right represent wind departures from average that are westerly. The entire system shifts eastward over time, eventually circling the globe and returning to its point of origin. Climate.gov drawing by Fiona Martin.
The near-surface winds in the tropics, called the trade winds, have a close relationship to the surface temperature of the ocean. The trades normally blow from east to west, helping to cool the surface and keep warmer water “piled up” toward Indonesia. If these winds relax, the surface waters in the central and eastern Pacific can warm up. This is a critical feedback mechanism for ENSO.
During La Niña, the trade winds are stronger than average, keeping the surface waters cooler (vice versa during El Niño). If the MJO is active, it can temporarily change the wind patterns. This past month, the MJO was active and moved through from the Indian Ocean into the western hemisphere, weakening the surface winds. But despite the winds temporarily weakening due to the MJO, the ocean remained cool. This leads forecasters to believe that La Niña conditions are in place and we can now see the forest for the trees.
This winter’s La Niña, although expected to remain weak, is likely to have some effect on North American weather and climate this winter. Be sure to check out Mike’s recent post for details on NOAA’s 2017/18 Winter Outlook, and stay tuned to the ENSO Blog for further updates on the great La Niña of 2017/18.
Bron:https://www.climate.gov/news-features/blogs/enso/november-2017-la-ni%C3%B1a-update-she%E2%80%99s-back